|
|
|
|
|
|
Wānaka Quarterly Visitor Data Snapshot
January - March 2025 (Q3 FY24-25)
|
|
|
|
|
|
|
|
|
|
|
Quarterly Insights for LWT Members
|
|
|
The Lake Wānaka Tourism's Quarterly Visitor Data Snapshots aim to provide members with access to topline information about the prior quarter’s performance. These insights have been gathered from the LWT Visitor Insights Dashboard. The Visitor Insights Dashboard provides members and stakeholders access to clear visitor data and RTO led research, supporting informed business decision making.
January - March (Q3 FY24-25) Overview
Between January and March 2025, Wānaka’s visitor expenditure reached $91 million, similar to the same period in 2024. International spending saw a significant 18% increase, while domestic expenditure decreased by 12%. A softening in domestic markets that require air travel, such as Auckland, contributed to this decline, whereas drive markets experienced a less significant reduction.
Commercial accommodation guest nights rose by 2% year-on-year with 331,400 guest nights hosted in the region. Commerical accommodation recorded an average occupancy rate of 73% in January - the highest recorded since COVID-19 - followed by 64% in February and 57% in March.
Wānaka hosted nearly 1.3 million cumulative visitor days, a 4% increase on the same period last year. The domestic market contributed the majority (60%) of cumulative visitor days.
The average Net Promoter Score (NPS) over the past three months has slightly decreased to 69. The 12 month rolling NPS average remains strong at 73. However, the NPS will be monitored closely over the coming quarters to determine whether this recent dip signals the beginning of a sustained trend.
Note: expenditure figures aren't inflation-adjusted.
|
|
|
|
|
VISITOR EXPERIENCE
The Visitor Experience Survey is a survey of visitors to the Queenstown Lakes district. The results are shared quarterly and outline a variety of experience aspects including; visitor motivations, connection with people and place, activities/attractions, net promoter score, and overall visitor experience satisfaction. The Visitor Experience Survey is Destination Queenstown and Lake Wānaka Tourism's collaborative research initiative facilitated by tourism research experts Angus & Associates.
|
|
|
|
|
|
|
Overall visitor experience satisfaction score
|
|
|
|
|
Source: Queenstown and Wānaka Visitor Experience Survey, Destination Queenstown facilitated by Angus & Associates. Sample size = 446. Last 12 months refer to 1 April 2024 - 31 March 2025, last 3 months refer to 1 January - 31 March 2025.
|
|
|
|
|
EXPENDITURE
Visitor expenditure refers to money spent on tourism-related activities while in Wānaka. LWT uses Worldline Marketview visitor spend figures as our expenditure measure. Worldline Marketview visitor expenditure is based on visitor in-person card transactions and does not include estimates for cash, online transactions and pre-bookings.
Note: this source is not adjusted to account for inflation.
|
|
|
Visitor expenditure January - March 2025 snapshot
|
|
|
|
|
Monthly total visitor expenditure
|
|
|
|
|
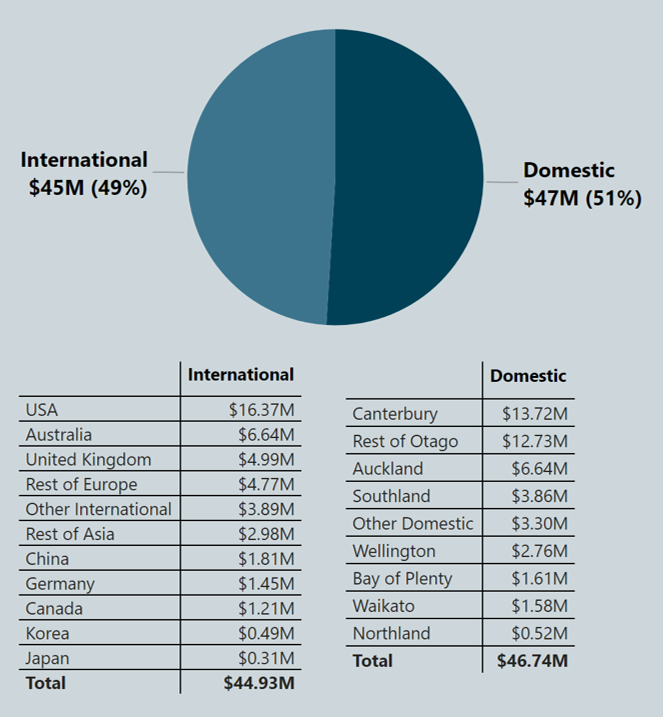
Visitor expenditure by region/country of origin January - March 2025
|
|
|
|
|
Source: Worldline/Marketview Tourism Data Tool.
vs prior year: percentage change vs same period 2024.
|
|
|
|
|
VISITATION - CUMULATIVE VISITOR ESTIMATES
The cumulative visitor estimates represent the total number of daily visitors counted over a specific period of time - usually a month or quarter, regardless of whether visitors stay for multiple days. For example, if someone visits for three days, they are counted three times in the cumulative estimate. The absolute international visitor counts and vs prior year metrics should be interpreted with caution. Further information.
|
|
|
Cumulative visitor estimates January - March 2025 snapshot
|
|
|
|
|
Monthly cumulative visitor estimates
|
|
|
|
|
Source: Vistr Visitor Volume Estimates. 1 January 2022 - 31 March 2025.
vs prior year: percentage change vs same period 2024.
|
|
|
|
|
COMMERCIAL ACCOMMODATION
Accommodation data is drawn from the Accommodation Data Programme. It provides insights into the total number of guest nights and occupancy in commercial accommodation providers.
|
|
|
Guest nights January - March 2025 snapshot
|
|
|
|
|
Monthly total guest nights
|
|
|
|
|
Occupancy rate April 2023 - March 2025 (last 24 months)
|
|
|
|
|
Source: Commerical Accommodation Monitor (Jan - Sept 2019), Accommodation Data Programme (Jun 2020 onwards).
|
|
|
|
|
NON-COMMERCIAL ACCOMMODATION
Accommodation data is drawn from AirDNA. It provides insights into the total number of property nights in non-commercial/ short term rental accommodation providers.
Note: property listing nights represent the number of properties/ listings booked, not the number of beds or guest nights.
|
|
|
Property listing nights January - March 2025 snapshot
|
|
|
|
|
Monthly total property listing nights
|
|
|
|
|
Source: AirDNA.
vs prior year: percentage change vs same period 2024.
|
|
|
|
|
|
|
|
|
|
|
|
|
Content Disclaimer: The content contained within this email is current at the time of publishing and has been gathered from the latest information available to LWT and DQ. This email and any files transmitted with it are confidential and intended solely for the use of the individual or entity to whom they are addressed. If you have received this email in error please contact us. Any unauthorised use, distribution or copying of the contents is prohibited.
Insights Disclaimer: Any information supplied is intended to inform about general historic destination performance based on information available at the time. It is not intended to be a substitute for further professional advice or more rigorous or specific analysis. It may not apply to an organisation’s specific situation and is not intended to be used or viewed in isolation. DQ and LWT assumes no liability for any actions taken based on supplied information or insights. The data sets, insights, and related resources provided are confidential to Lake Wānaka Tourism and its membership base only and are not for publication or dissemination.
|
|
|
|
|
|
|
|
|
Make sure this email goes to your inbox, add info@wanaka.co.nz to your address book.
© 2023 Lake Wānaka Tourism
99 Ardmore Street, Wanaka 9305, New Zealand
|
|
|
|
|
|
|